Spatial aspects of the primary infectious sources and secondary spread of Clavibacter michiganensis subsp. michiganensis using data-driven approach
|
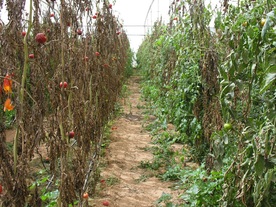
Clavibacter michiganensis subsp. michiganensis (Cmm), the causal agent of bacterial canker and wilt of tomato, and is considered to be one of the most important bacterial pathogens worldwide. Plants infected from the primary sources of inoculum can cause secondary spread to nearby healthy plants. Spatial patterns of disease level can provide important clues to the primary infectious sources and secondary spread of diseases. We monitored hundreds of greenhouses and employed advanced statistical modeling approaches to identify the factors contributing to the spread of Cmm.
Publication: Blank L, Cohen Y, Borenstein M, Shulhani R, Lofthouse M, Sofer M and Shtienberg D (2016). Variables associated with severity of bacterial canker and wilt caused by Clavibacter michiganensis subsp. michiganensis in tomato greenhouses. Phytopathology 106(3): 254-261 [pdf] Journal Link |
Distribution and habitat specificity of potentially-toxic Microcystis across climate, land and water use gradients
|
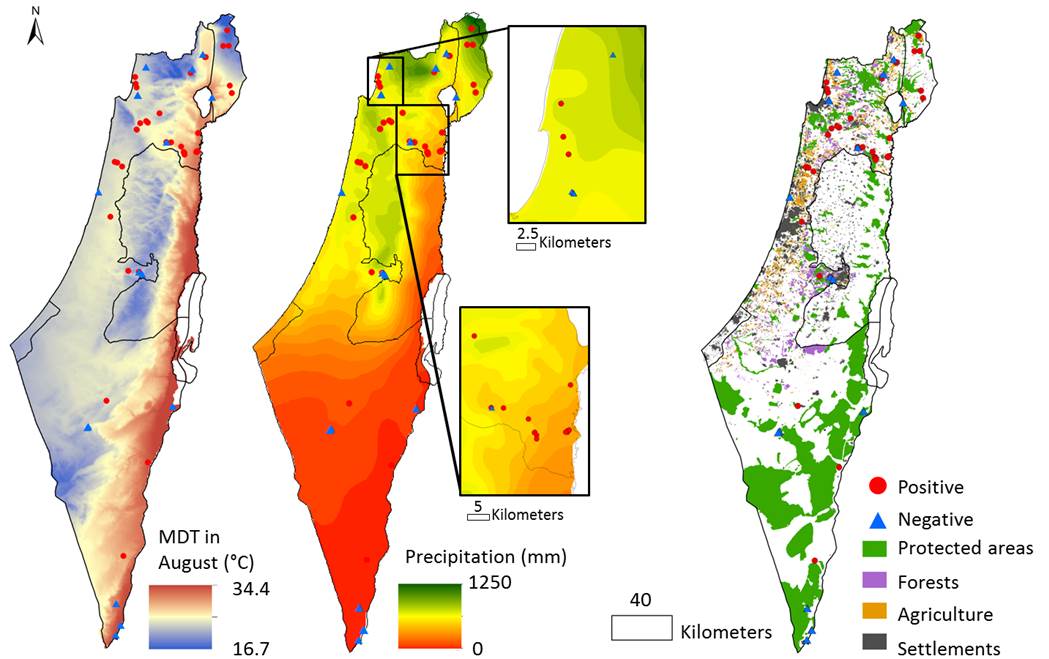
Microcystis spp. is one of the most abundant cyanobacteria worldwide, and is responsible for harmful and occasionally deadly blooms. In this work we studied the distribution patterns of “seed populations” of Microcystis with the genetic capacity to produce microcystins in different freshwater bodies across Israel. We analyzed the effects of local and regional climate and land use on the distribution of these toxinogenic cyanobacteria.
This project is in collaboration with Dr. Daniel Sher (University of Haifa). Publication: Marman S, Man-Aharonovich D, Grossowicz M, Blank L, Yacobi Y and Sher DJ (2016). Distribution and habitat specificity of potentially-toxic Microcystis across climate, land and water use gradients. Frontiers in Microbiology 7: 271 [pdf] Journal Link |

Environmental gradients and the distribution of toxinogenic Microcystis seed populations across Israel. Dots represent sampling locations where mcyD gene was detected (red circle) or not detected (blue triangle). Left – average day temperature range in August; Center – Average precipitation; Right – land use.
|

